Iseult
A TKinter based python 3.7 GUI for visualizing Tristan-MP plots. A work in progress.
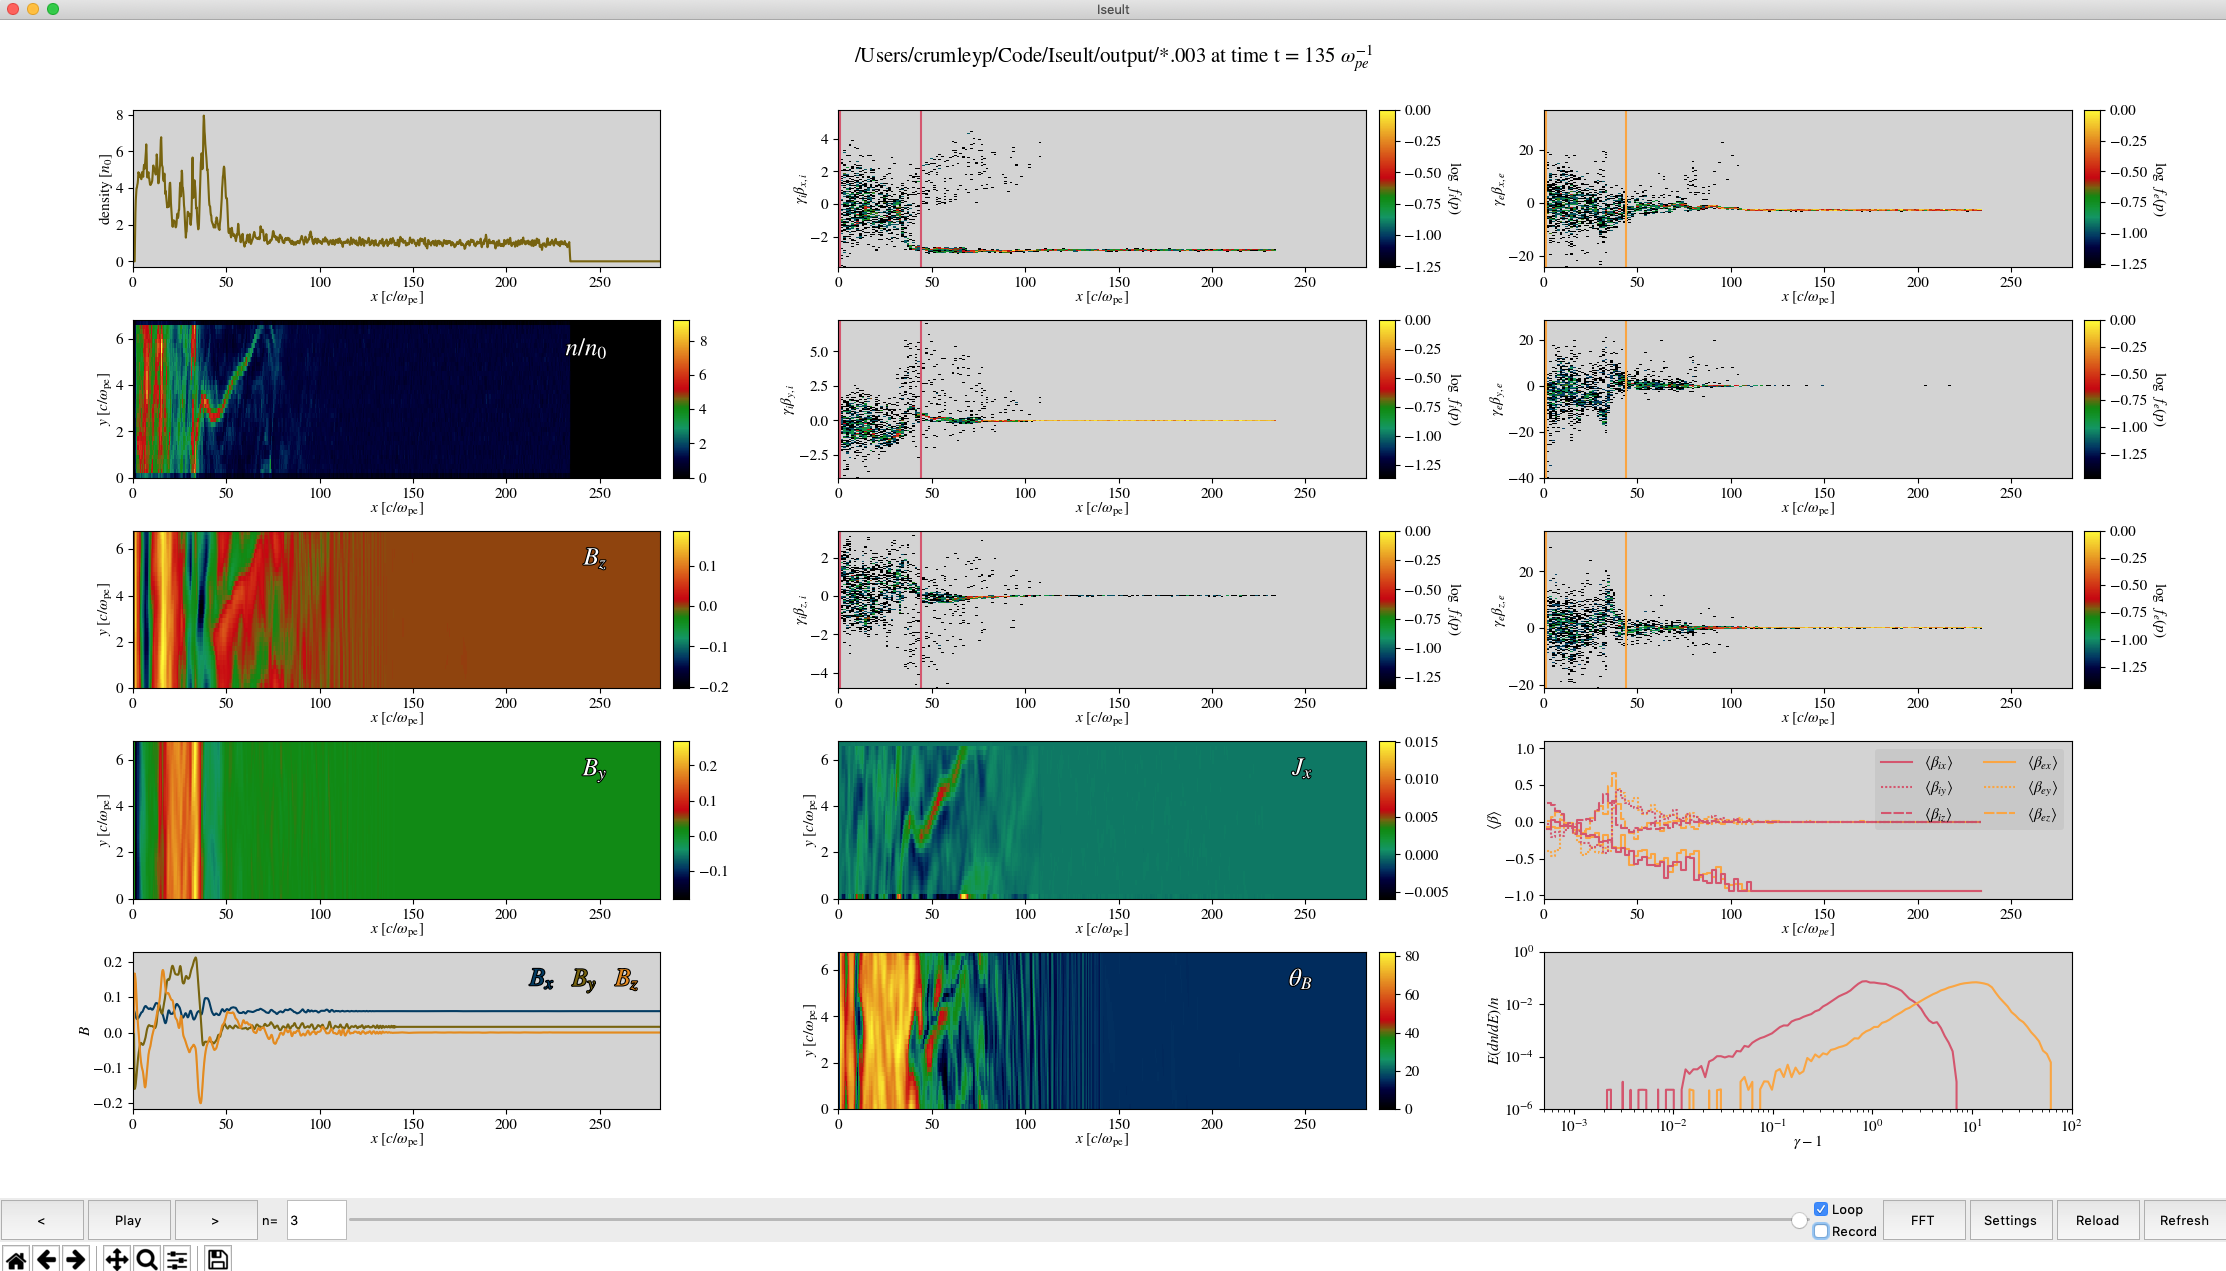
An example visualization of a Tristan-MP simulation. It’s basically a skinned version
of the interactive matplotlib figure, where you can go through your timesteps by
pressing the arrows left and right on the bottom. All graphs (and graph types)
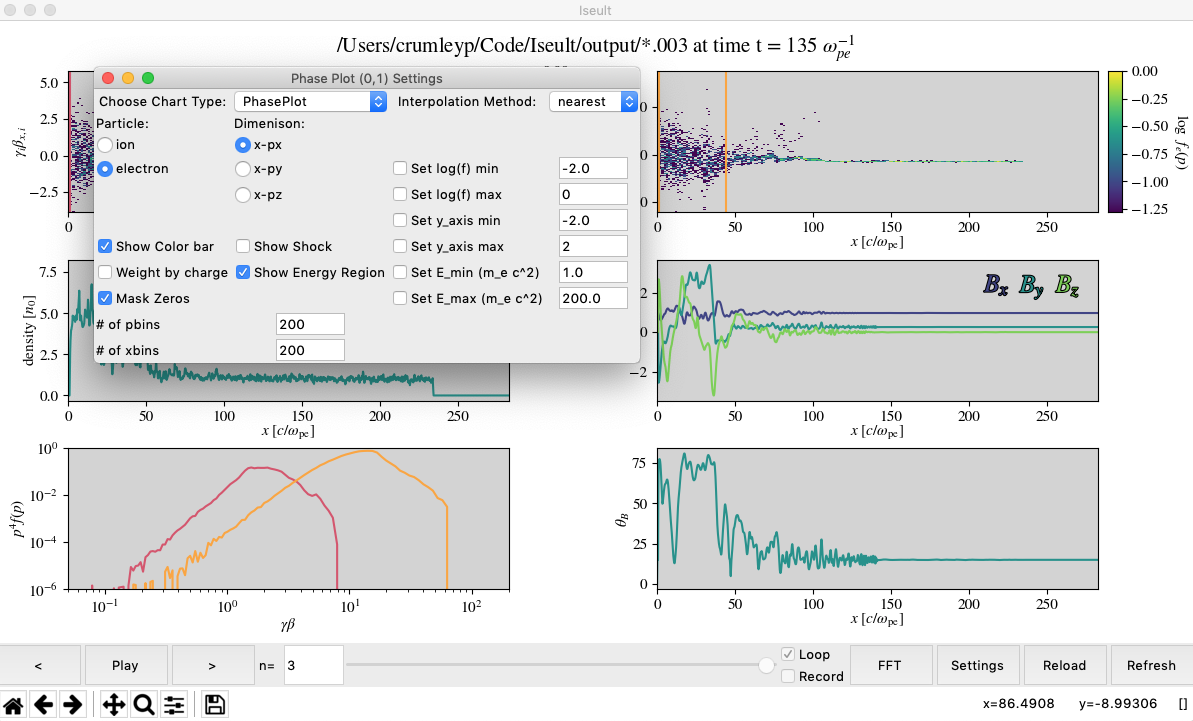
are configureble by right clicking on the subplot
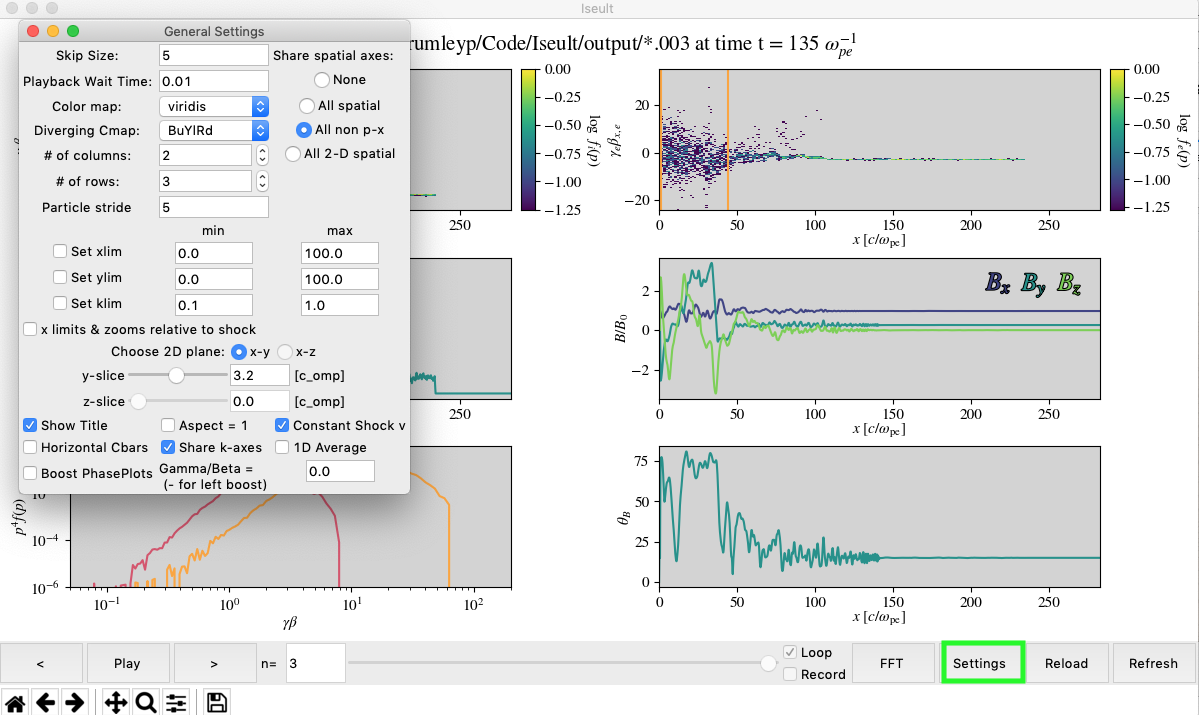
Things like the number of rows and columns can be changed by clicking the settings
button on the bottom:
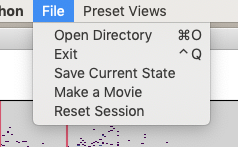
If you get a set-up you like and want to save for the future, go to the file menu and click ‘Save Current State.’ This saves a config file in the .iseult_configs file. The config files are directly editable (you have access to change things that you can’t in the GUI), and they can be loaded in future using ‘Preset Views’ menu.
Also in the file menu is the option to save movies using ffmpeg. If ffmpeg is not installed, you can make a movie by using the ‘record’ checkbox on the bottom and click play. This creates a ‘Movie’ folder and saves pngs everytime Iseult reloads a plot. You can then put these together into a movie/gif/whatever.
Written by:
Patrick Crumley, patrick.crumley@gmail.com, based on Jaehong’s Tristan analysis IDL script.
UPDATES:
May 8th 2019: Ported code to python 3.7.x & Matplotlib 3.0.x There may be a few bugs here and there, but I think it is working.
The code is now it’s beta phase. See the implemented column for what has already been implemented.
Dependencies:
Python packages required: Anaconda 2019/3, matplotlib 3.0 & its required dependencies, python 3.7.3, h5py. Will not work with older versions of anaconda3 and matplotlib 2.0 or older.
To use the movie saving feature: ffmpeg & xterm.
Iseult should work on Windows, MacOS & Linux.
To run Iseult on tigressdata type the following:
$ module load anaconda3/2019.3
$ cd /path/to/Iseult/
$ chmod +x ./iseult.py
$ ./iseult.py
When Iseult is started, it checks to see if Tristan-MP data is located at the current path, if it isn’t Iseult prompts you to select the directory of where your Tristan-MP data is saved. To edit/change any of the plots, just right click on the subplot directly. You can also change the number of columns, the colormap, and other general settings by clicking the settings button. The measure button allows you to take measurements like T_i, T_e, measure spectra, take 1-D FFTs, etc. The matplotlib interactive toolbar is beneath the playbar, it allows you to save the figure, use your mouse to zoom around, etc.
If you get a set-up you like, you can go to file menu and choose Save Iseult State. It will give you an option to name the ‘view.’ To replace the default state of Iseult, name the view Default. The views are saved as .cfg files in .iseult_configs folder. You must restart Iseult to see the saved config in the preset views menu.
Enjoy!
| Implemented: |
|---|
| Time stepping |
| Movie (without recording) |
| Basic plotting |
| ability to modularly change plots. |
| plot control panels to edit things about indv. plots |
| shock-finding |
| figure saving |
| Ability to take measurements |
| ability to save Iseult settings in a config file |
| zooming |
| Left to Implement: |
|---|
| gifs/movies |
| Longer term goals (???) |
Resources:
| Useful links | | ———————– | | http://python.org | | http://effbot.org/tkinterbook/ | | http://matplotlib.org | | http://matplotlib.org/users/navigation_toolbar.html | | http://h5py.org |